40+ Years of Macro Trading Insight
Most Investors Read The News After
The Move Starts
Read the Board Before the Market Reprices
Every week, Andy’s Thoughts on the Market gives you the macro forces, trade structure, and key levels to watch across S&P 500 futures, gold, and crude oil, so you can see where pressure is building before consensus catches up.
After 40+ years trading macro across 70+ markets, Andy Krieger has learned that the edge is not in reacting to the headlines, it’s in reading the structure that forms before the market reprices.
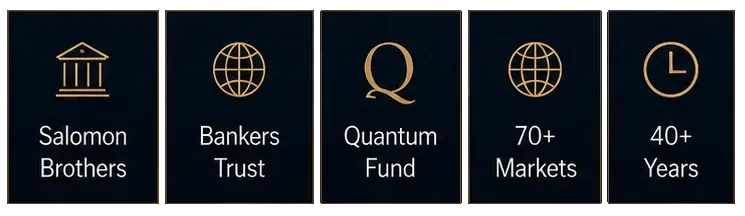
Bankers Trust
Quantum Fund
Central Bank Advisor
70+ Markets
40+ YearsExperience
40+ Years of Macro Trading Insight
The Macro Insights From The Trader Who Moved Markets
Most Investors Read The News After The Move Starts
Every week, Andy’s Thoughts on the Market gives you the macro forces, trade structure, and key levels to watch across S&P 500 futures, gold, and crude oil, so you can see where pressure is building before consensus catches up.
After 40+ years trading macro across 70+ markets, Andy Krieger has learned that the edge is not in reacting to the headlines, it’s in reading the structure that forms before the market reprices.
Get The Mind Of
A 10-Figure Trader, Delivered Weekly
Andy Krieger’s weekly Market Map gives you unfiltered access to a market mind built across Salomon Brothers, Bankers Trust, Quantum Fund, and decades inside his own asset management business.
THE STRUCTURE BENEATH
Every MOVE
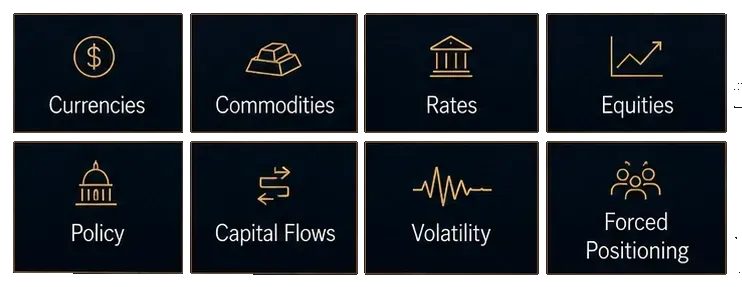
Each week, Andy shows you how these forces connect so you can see a more complete view of the board.
> Currencies.
> Commodities.
> Rates.
> Equities.
> Policy.
> Capital flows.
> Volatility.
> Forced positioning.
And once you see the board more clearly, the market starts to look different.
Pressure in one market can create movement in another.
Movement can reveal risk.
Risk can reveal opportunity.
The headline is not where the information begins. It is usually where the information becomes obvious.
Institutional traders
understand this.
They are not just reading the news. They are reading the pressure underneath it.
That is what Andy’s Market Map gives you access to.
A more structured way to see how markets connect, where pressure may be building, and what the board may be revealing before the move becomes obvious.
When you can see the board, you are no longer just reacting to the headline.
June 2025:
The Cost of Being Late.
In June 2025, Andy Krieger mapped out a scenario where a desperate Iran could close the Strait of Hormuz.
Nine months later, when chaos hit, his readers were not left trying to decode the market in real time.
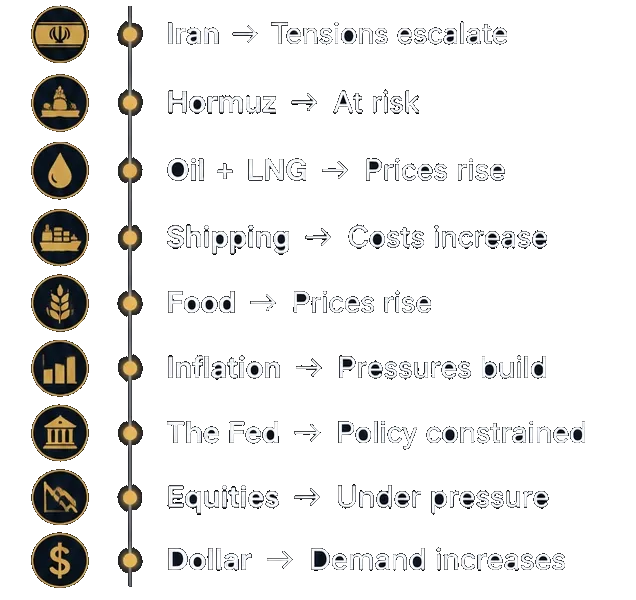
The value was not just knowing
oil could move.

The value was knowing
what oil could force next
With Andy’s weekly market map, you are not left guessing the timing.
You get the setups.
You get the triggers.
You get the conditions worth watching.
So instead of trying to predict the exact month… You can see what confirms the move.
And while most investors are still reacting to the headline, the map allows you to already know which signs matter.
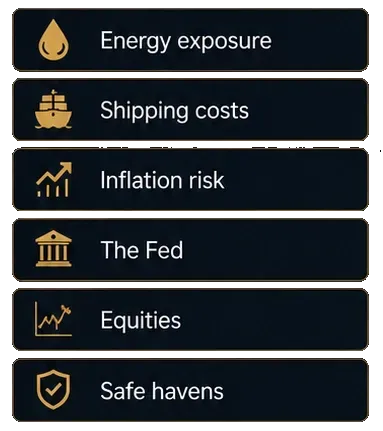
That is why Andy's subscribers stay ready before the break.
Get The Mind Of
A 10-Figure Trader, Delivered Weekly
Andy Krieger’s weekly Market Map gives you unfiltered access to a market mind built across Salomon Brothers, Bankers Trust, Quantum Fund, and decades inside his own asset management business.
Each week, Andy shows you how these forces connect so you can see a more complete view of the board.
> Currencies.
> Commodities.
> Rates.
> Equities.
> Policy.
> Capital flows.
> Volatility.
> Forced positioning.
And once you see the board more clearly, the market starts to look different.
BUILT ON EXPERIENCE. EARNED OVER TIME
THE STRUCTURE BENEATH
EVERY MOVE
PRESSURE IN ONE MARKET CAN CREATE MOVEMENT IN ANOTHER.
MOVEMENT CAN REVEAL RISK.
RISK CAN REVEAL OPPORTUNITY.
The headline is not where the information begins. It is usually where the information becomes obvious.
Institutional traders
understand this.
They are not just reading the news. They are reading the pressure underneath it.
That is what Andy’s Market Map gives you access to.
A more structured way to see how markets connect, where pressure may be building, and what the board may be revealing before the move becomes obvious.
The Cost of Being Late.
In June 2025, Andy Krieger mapped out a scenario where a desperate Iran could close the Strait of Hormuz.
Nine months later, when chaos hit, his readers were not left trying to decode the market in real time.
Crude had traded near $55
Andy warned oil could move back above $95, and potentially over $100 if Hormuz became involved.
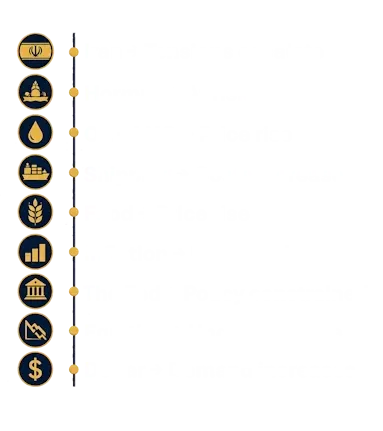
The Chain Reaction
The value was knowing what oil could force next
With Andy’s weekly market map, you are not left guessing the timing.
You get the setups.
You get the triggers.
You get the conditions worth watching.
So instead of trying to predict the exact month… You can see what confirms the move.
And while most investors are still reacting to the headline, the map allows you to already know which signs matter.
Inside The
Andy Krieger Letter
Every week, Andy gives you a sharper way to read what is moving beneath the surface before the market fully prices it in.
So you are not left waiting for the headline. Or trying to connect disconnected signals on your own.
But this is not another market recap.
It is a weekly Market Map built to take you from the largest forces in the world down to the specific levels that matter now.
First, Andy gives you the big picture.
He shows you what is moving beneath the surface, where pressure is building, and what the market may be mispricing before consensus catches up.
Then the Market Map bridges that macro view into the markets traders should be watching right now.
Finally, Imre Gams, Andy’s co-author and technical analyst, maps the exact price levels where those forces may show up in real time.
Each issue focuses on three core markets:
- S&P 500 futures.
- Gold.
- Crude oil.
Andy gives you the macro pressure behind the move.
Imre gives you the levels where that pressure may matter on the chart.
Together, they give you a complete Market Map:
- The macro forces.
- The trade structure.
- The levels to watch.
So instead of drowning in more information… You get a better read.
A sharper view of where pressure is building…
What could confirm the move…
And where the market may reveal its
hand next.
Because by the time the headline explains the move, the market may have already started repricing it.
Inside The Andy Krieger Letter
Every week, Andy gives you a sharper way to read what is moving beneath the surface before the market fully prices it in.
So you are not left waiting for the headline. Or trying to connect disconnected signals on your own.
But this is not another market recap. It is a weekly Market Map built to take you from the largest forces in the world down to the specific levels that matter now.
First, Andy gives you the big picture.
He shows you what is moving beneath the surface, where pressure is building, and what the market may be mispricing before consensus catches up.
Then the Market Map bridges that macro view into the markets traders should be watching right now.
Finally, Imre Gams, Andy’s co-author and technical analyst, maps the exact price levels where those forces may show up in real time.
Each issue focuses on three core markets:
- S&P 500 futures.
- Gold.
- Crude oil.
Andy gives you the macro pressure behind the move.
Imre gives you the levels where that pressure may matter on the chart.
Together, they give you a complete Market Map:
- The macro forces.
- The trade structure.
- The levels to watch.
So instead of drowning in more information… You get a better read. A sharper view of where pressure is building…
What could confirm the move… And where the market may reveal its hand next.
Because by the time the headline explains the move, the market may have already started repricing it.
Access The Information Behind A 10-Figure Market Mind
When you follow Andy’s current read and Imre’s technical levels each week, you’re no longer trying to make sense of the market from the outside.
You’re looking at the board through the lens of someone who has spent more than 40 years reading macro pressure, dislocations, volatility, and opportunity across global markets.
And you’re seeing the levels where that pressure may begin to matter on the chart.
As that read comes in week after week, you’ll start to see the market differently.
Less noise.
More structure.
Less reaction.
More recognition.
Because the next move usually starts forming before the headline explains it.
The next Market Map is where you start.
Access The Information Behind A 10-Figure Market Mind
When you follow Andy’s current read and Imre’s technical levels each week, you’re no longer trying to make sense of the market from the outside.
You’re looking at the board through the lens of someone who has spent more than 40 years reading macro pressure, dislocations, volatility, and opportunity across global markets.
And you’re seeing the levels where that pressure may begin to matter on the chart.
As that read comes in week after week, you’ll start to see the market differently.
LESS NOISE.
MORE STRUCTURE.
LESS REACTION.
MORE RECOGNITION.
Because the next move usually starts forming before the headline explains it.
The next Market Map is where you start.
andy Krieger
Lorem Ipsum is simply dummy text of the printing and typesetting industry. Lorem Ipsum has been.


Quick links
Support
Privacy Policy
Terms & Conditions
Copyright 2026. TAILORED EXIT. All rights reserved.